When I was a Kollective customer at one of the largest banks in America, I developed an Online Video Team to manage on Demand publishing and live event streaming. Today, that team is an integral part of the planning and execution of hundreds live video events. These events range from CEO and senior leader all hands to team member learning and development. Regardless of the topic or size, there is a tremendous amount of strategy, planning and resources that go into each successful production. But what happens after the event? Sure, you can hand over a viewership report to your business stakeholder, but she might ask you: “Is that GOOD??”
Just last month, Kollective released our latest enterprise-ready analytics tool, Kollective IQ. As always, we deliver in-the-moment views of viewership metrics and a full complement of network and bandwidth analytics. Now, with IQ, you can take that information and create custom dashboards for your “at a glance” metrics convenience.
Our IT friends love the views of network performance and bandwidth behavior. Kollective IQ’s ability to drill down deeper and see individual details will thrill them, and this information is very useful on the business side too. Let’s start with viewer metrics.
#1 KPI – Unique Viewers
This number identifies the “reach” – the number of individuals who watched the content, be it live or on-demand. a With SAML/Active Directory integration you can use this one metric to find out common characteristics of the viewing population; including “which lines of business were most interested in the content?”, “where are the most viewers located?”, or “does a particular business segment watch this type of content?”

#2 KPI – Average View Duration
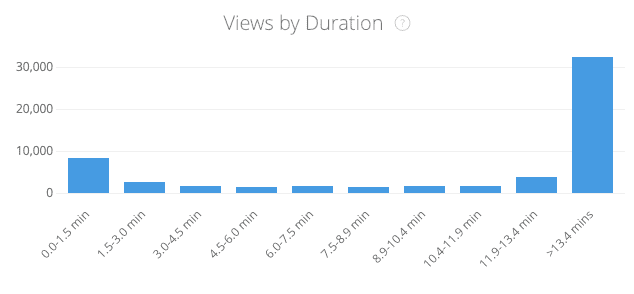
This is a quick and easy way to tell if the content was engaging. It’s measured in minutes, not a percentage, so it is easy to match up to the length of the event. You can drill into this data to see if there’s a common drop off time that you can compare to the content and see what was happening at that time. Q&A is sometimes a drop off point, especially if the program is running long.
In the example below, the content was thirteen and a half minutes long. From the graph, you can see that most people watched the whole program.

Another metric that matters to the business side is: are the bosses watching? You can use the User Name field and do a quick crosscheck against Employee ID numbers or log in IDs to see who’s there.
#3 KPI – Buffering Report
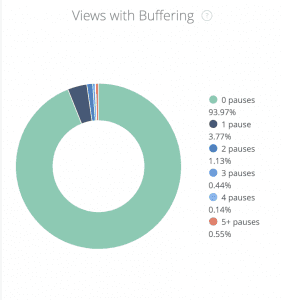
 For me, the most useful technical metric during a live event is the buffering report. If there is buffering in a specific location you can pull out user data and connect with them, informing them that you are aware of the problem and remind them they can watch on-demand after the live event. And, a quick call to your Help Desk lead with this information will make you a hero.
Managing executive expectations and defining what “good” looks from a data-driven approach can help you communicate the success of your enterprise video events and pave the way for future improvements. I’ve covered just a few of the new features of our analytics dashboard. There’s so much more to dive into with Kollective IQ; live event metrics give you updates as viewers join and exit the event along with real time network monitoring. VoD metrics give you a picture of viewership over time and the all-powerful peering efficiency of the content delivery.
take your events to the next level
Learn more about how Kollective IQ can easily provide you with the metrics that matter for your business and how easy it is to customize video viewing and performance metrics for your stakeholders.
Related Blog Posts
Live Enterprise Video Brings Out The Passion In Your Workforce
As the Enterprise Video Strategy Manager for Kollective in EMEA, I help our customers reach video success. I get the opportunity to engage with all the people involved in producing live events; whether they are speakers, owners, part of in-house production or hired…
Video on Demand Strategy: Put Your Content Where Your People Are
Over the years, Kollective’s customers have been driving innovation in content strategy. Building upon the basics of executive messaging and training, companies have launched regular programs that deliver company information, co-workers doing great things in their…
Is Video The Answer To Overcoming Employee Change Fatigue?
You can’t browse LinkedIn these days without seeing article after article about digital transformation. At Kollective, we’re as “guilty” as everyone else in the industry in focusing our content around the challenges and opportunities facing companies as they undertake…
The post When it comes to your video strategy, what does “good” look like? appeared first on Kollective Technology .


