facebookpixel

Performance Monitoring in Real Time

analytics

Performance Monitoring in Real Time

Real-time analytics allow businesses to quickly detect and address issues as they arise. It empowers your IT and network teams with faster decision-making capabilities and affords your business greater operational agility. In this article, we’ll show you how to monitor key performance metrics of your live events in real time using our advanced analytics platforms, Kollective IQ and Kollective Free Analytics .

This is our second article in a series of posts on real-time analytics. If you haven’t read the first article, explore How Real-Time Analytics Benefit Your Communications Strategy here .

Monitor Stream Quality in Real Time

Kollective IQ and Kollective Free Analytics provide several ways to track the stream quality of your event in real time. In the analytics dashboards, stream quality is represented by QoE (Quality of Experience). Start with the “Reach by QoE” tile in the views and experience dashboard. The donut chart displays the percentage of viewers experiencing each level of QoE, from excellent to bad.
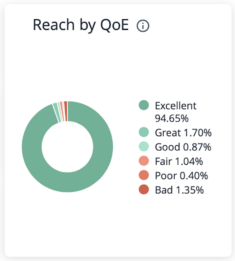
Reach by QoE

In the example above, we notice that 1.35% of our audience has experienced bad streaming quality at some point in this event. Rather than waiting for our event to end, we can explore this data while our event is still in progress. Simply click on the section of the Reach by QoE chart you want to examine to bring up detailed statistics broken down by user. Clicking on the “bad” section of the chart reveals new data fields to help you diagnose potential issues (see below).
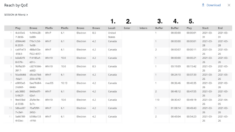
Reach by QoE analytics

While there are many columns in this report, highlighted are five of the most useful:

  1. Locality – The viewer’s country
  2. External IP – The viewer’s external IP address
  3. Number of Buffering Events – The number of separate buffering instances the viewer experienced
  4. Total Buffering Time – The amount of time spent buffering during playback
  5. Total Playback Time – The amount of playback time without buffering

Reviewing the detailed statistics on “bad” QoE scores reveals a series of users experiencing varying degrees of buffering. Some users are experiencing lengthy buffering delays, while it appears others abandoned the stream early perhaps in response to buffering problems. Looking at the most severe cases, we notice that most of these users are located in Canada and share the same external IP address (note: IP addresses have been obscured for privacy purposes).

In a few quick steps, we’ve determined that employees at a Canadian office are having buffering problems. Armed with this information, we can contact IT at this office to resolve the issue while our event is still running. We can also send the event as video on demand (VOD) to all employees at that location as soon as the event ends to ensure essential messaging isn’t missed.

Identify Buffering by Location in Real Time

The delivery and consumption dashboard in Kollective IQ and Kollective Free Analytics provides another method for monitoring stream quality in real time. In the previous example, you learned how to analyze groups of viewers that experienced the same QoE and identify potential geographic trends. In this example, we’ll start with geography and show how to quickly and easily detect issues.

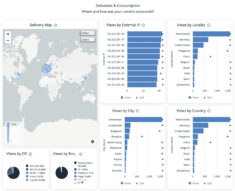
Before diving into the example, let’s review the delivery and consumption dashboard. The primary areas of concern for this dashboard are the delivery map on the left and the four bar graphs on the right. The map contains a series of circles that represent event viewership for a given location (larger circles equal areas of greater viewership). The bar graphs list the top ten areas of viewership broken down by: external IP, locality, country, and city. Each field on the bar graphs has a corresponding QoE dot that represents the average streaming quality for that location.
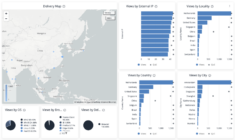
Delivery Map Free Analytics for Microsoft Teams

Starting with a high-level overview, we see that all countries listed in the top ten have good QoE scores except China. Notice in the Views by City graph that the Shanghai office is performing poorly. Click on the Shanghai bar graph to explore this data or zoom into the delivery map to select the Shanghai office, excluding any nearby remote viewers.
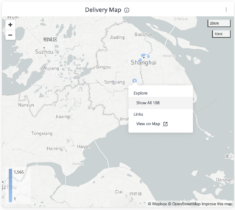
Delivery Map City Example - Free Analytics

Since these graphs provide a quick QoE reference for the ten locations with the highest event viewership, it’s often the fastest way to detect buffering and stream quality issues for events in which ten or less offices are participating. However, with events streaming to more than ten locations it’s best to use this dashboard in conjunction with the “Reach by QoE” tile discussed in the first example of this article.

Track Microsoft 365 Video Performance in Real Time

Are you using Microsoft Teams or Stream to deliver live and on-demand video? Gain real-time insights into event performance and employee behaviors with Kollective Free Analytics today.

The post Performance Monitoring in Real Time appeared first on Kollective Technology .

To view our Partner blog, click here

What’s New in Kollective IQ?

analytics

What’s New in Kollective IQ?

Kollective IQ, our advanced analytics platform, has new dashboards that will reveal some key performance indicators (KPIs) commonly used to assess event performance. The dashboards have been redesigned to help better understand the impact and quality of your events, engagement across the enterprise, and so much more!

Kollective IQ contains three primary dashboards:

  1. Views & Experience
  2. Delivery & Consumption
  3. Network Performance

Views & Experience Dashboard

The views and experience dashboard displays the reach, stream quality, and engagement of an event. Top-level insights are easily digested through the six key performance indicators (KPIs) displayed in the dashboard. Users can drill down to explore data on specific users by interacting with the graphs. If you hover over a tile, there are options in the upper right corner that will allow you to download or explore the data, and even set an alert for metrics that could be of particular interest.

Kollective IQ Views and Experience Dashboard

Quality of Experience (QoE) Score is an aggregate rating, representing the overall stream quality for everyone that viewed an event. This score is a combination of two factors — the quality of video received (measured by bitrate) and the time to first frame.
Reach indicates how many unique viewers streamed an event.
Max Reach represents the greatest number of simultaneous viewers during an event.
Average View Duration measures the average amount of time viewers spent watching the event.
Reach by QoE is a pie-chart organizing viewers by the level of stream quality they experienced during an event. Scores are displayed on a graded scale, ranging from excellent to bad. Click on the pie-chart to explore specific segments in greater depth.
Event Reach Over Time reports the reach for every minute of the event. This indicates audience engagement, allowing one to easily identify changes in attendance over the course of an event. Monitor this graph while your event is running for engagement insights.

With the views and experience dashboard, your team will understand:

  • How many people attended an event
  • When attendees joined and left an event
  • How engaged employees were during an event
  • Any issues with buffering and stream quality

Delivery & Consumption Dashboard

With hybrid work becoming the new norm, it’s crucial that businesses understand where and how their content is streamed to ensure video communications are successfully delivered throughout the enterprise. This delivery and consumption dashboard does just that. The intuitive graphs and interactable map enable the rapid identification of locations that experienced buffering problems during an event.

Kollective IQ Delivery and Consumption Dashboard

Delivery Map shows everywhere your event was viewed. Larger circles indicate areas with greater viewership. Users can explore and interact with the map directly. Click on clusters to view detailed data for specific offices or locations.
Views by Location are a series of four separate bar graphs that are broken down into geographic segments (external IP, locality, country, and city). Each graph lists the top ten places with the most event views. These charts include QoE dots that represent stream quality for each location. See a region with poor stream quality? Click on the corresponding bar graph to explore the data in more detail, uncover potential trends, and develop a resolution plan.
Views by OS details which operating systems were used to stream an event.
Views by Browser displays which browsers were used to stream an event.

With the delivery and consumption dashboard, your team will understand:

  • Where an event was streamed
  • Which offices participated most in an event
  • Where issues with stream quality and buffering occurred
  • What browsers and operating systems were used

Network Performance Dashboard

The network performance dashboard shows how much bandwidth was saved by using Kollective’s enterprise content delivery network (ECDN) to deliver the event. Kollective IQ’s dashboard offers a unique lens into network performance, allowing users to monitor an event’s impact on their network in real-time as an event runs and after it ends.

Kollective IQ Network Performance Dashboard

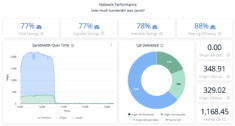
Total Savings is the total bandwidth savings for all viewers of an event, including those not capable of peering.
Capable Savings is the total bandwidth savings for all viewers of an event that were capable of peering.
Peerable Savings is the total bandwidth savings for all viewers that successfully peered an event (joined a cluster with other peers).
Peering Efficiency displays the percentage of bandwidth that was delivered through peering in relation to the size of each peering group.
Bandwidth Over Time shows the amount of bandwidth that’s consumed over the course of the event. This graph is an excellent indicator of the ECDN’s performance. The green portion of the graph represents the amount of bandwidth that was pulled from your network, while the blue portion displays the amount saved from peering.

With the network performance dashboard, your team will understand:

  • How much bandwidth Kollective’s ECDN saved your network
  • Bandwidth utilization over the course of an event
  • How well your event was peered

Kollective IQ – A Perfect Addition to Your Communication Platform

Adding an advanced analytics platform like Kollective IQ supercharges your broadcast event reporting, yielding actionable insights to help you understand employee experiences and maximize performance.

The post What’s New in Kollective IQ? appeared first on Kollective Technology .

To view our Partner blog, click here

Distributed Devices: Reaching The Edge In The Age of IoT

analytics

The world of work is changing. From cloud computing systems to remote working opportunities, technological innovations are becoming an integral part of our professional lives.

As part of this changing culture, businesses are increasingly contending with how to incorporate the ‘Internet of Things’ (IoT) into the modern office environment. Wearable technology, smart gadgets and intelligent lighting systems are just a few examples of hardware that IT departments will soon add to their internal networks.

But just like any other machine on a company’s network, it’s vital that these IoT devices receive regular updates for maximum security and functionality.

This presents a complicated problem for IT managers to solve — with the IoT bringing new operating systems, new update schedules and thousands of new devices into the workplace.

Given so many of these devices will operate at the edge of the corporate network, how can IT departments connect their IoT devices at scale and ensure they stay up to date without putting a huge strain on existing IT systems and network infrastructure?

To understand these concerns, and explore the future direction of enterprise content delivery, we at Kollective are pleased to announce the launch of our latest research report: Distributed Devices: How Today‘s IT Leaders Are Taking Their Businesses To The Edge.

This report draws on research from 270+ IT decision makers across the US and UK, providing insights into what companies must examine when integrating the IoT into their systems and the role that Software-Defined Enterprise Content Delivery Networks (SD-ECDN) will play in the future of Enterprise IT and IoT update distribution.

The post Distributed Devices: Reaching The Edge In The Age of IoT appeared first on Kollective Technology .
To view our Partner blog, click here

The Bloody Edge: Data Observations from the Digital Transformation

CMMA Blog

A few colleagues and I have some long running jokes, thanks in large part to Dilbert and The Office, where we slip borderline meaningless business phrases into our stand-ups and backlog grooming sessions. Shout out to the agile teams out there! We slyly talk “synergies” (with hands clasped together for full effect of course). A deft reference to a “holistic solution”, or a winked question asking “yes, but can we operationalize it?” will score some extra humor points. There is one though, that we don’t quite know what to do with yet, because while the meaningfulness of the others came and went, we are still living and defining perhaps the most pervasive business term right now. In the enterprise software space, there are few more loaded and nebulous terms than “digital transformation”. General consensus tells us that it is the use of new technologies, software and cloud services to solve ages old business problems… Which… Is a rather wide berth for applying any meaning to the term. What we do know, and observe day in and day out, is that marketplaces, businesses and even entire economies can change overnight. And moving forward, our success is completely tied to ability to adapt to these changes. No small task for unwieldy and often slow-moving enterprises.

Which means as a leader of a software team with a value prop tied to this business wave, I needed to do some introspection with the team to see how we fit into this revolution, and in the end, how are we helping individuals and businesses adapt to the onslaught of changes they are facing in today’s volatile markets. Giving more importance to this is that our promise here at Kollective is to help the enterprise power those transformations by giving them more bandwidth, by powering meeting software to connect coworkers across the globe, allowing IT groups to push software and security patches out to the edge of their networks with the push of a button, all while delivering deep intelligence back that inform and let decision makers know what really matters at the end of the day… “how are we doing?”.

This introspection is helpful, and even critical, to understanding how we can build software that moves the needle, instills confidence, and pushes teams to digitally transform in a way that is empowering. And since we build software that powers this, to get to these answers we began looking at the data that we produce to find the leading indicators of enterprises that are successfully transforming. Over the next two articles, we will explore the data on the bleeding edge, and how that data can inform us about the pathways to successfully achieving this, and it’s impact on how companies can fuel their change.

Learn for yourself how Kollective can scale your enterprise digital transformation initiatives with a Free Trial.

Related Blog Posts

The post The Bloody Edge: Data Observations from the Digital Transformation appeared first on Kollective Technology .
To view our Partner blog, click here

Critical Analytics At Your Fingertips With Kollective IQ

analytics

According to Gartner , “CIOs globally ranked analytics and business intelligence as the most critical technology to achieve the organization’s business goals.” Ventana Research  found that many capabilities still not available include predictive analytics & visualization.  

These data points act as the pillars for our new analytics product, Kollective IQ. Kollective IQ is the most sophisticated delivery management performance dashboard for the enterprise. We’ve provided easy access to the data you need, that’s visually appealing and gives your network and communications teams actionable insights.    

No matter your role within an organization, you can quickly access information most relevant to you. In this post, we’ll begin to explore four new benefits of Kollective IQ.  

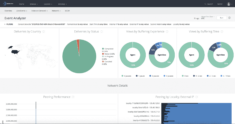
Event Analyzer Dashboard

Screen Shot 2018 12 05 at 9.25.50 AM

Our event analyzer dashboard provides users with network-focused visibility so that they can view historical data from any specific event as well as seeing what is happening during an event in real-time. This provides invaluable insight across the company, allowing IT teams to monitor bandwidth, CEOs to see how many people tuned into their latest company update, and communications professionals to see how effective video content is proving across different offices or departments. 

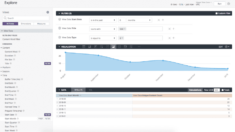
Dashboard Drill Downs

Screen Shot 2019 01 25 at 2.14.52 PM

Every tile in the dashboard is now drill-able, allowing users to pinpoint where there were buffering issues, slowdowns or glitches. This enables users to drill down into data from months, weeks or even a specific live event. Intelligent keywords also makes it possible for users to analyze multiple events based on the same theme. 

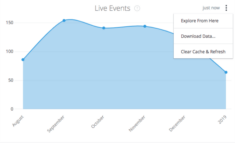
Portability

Screen Shot 2019 01 25 at 2.18.30 PM

Kollective IQ’s new report-export features, data visualizations and search filters mean that users can easily and rapidly explore or download the data that matters most to them. Export the reports or your entire dashboard into a PDF, as a CSV or you can send it directly through email. You can even schedule automated future reports. Your metrics that matter are no longer locked in a single system and you can use any of these export actions to get your data into any other BI solution you are using. 

ToolTips

Screen Shot 2019 01 25 at 2.19.55 PM

Tile-based ToolTips and real-time help features have been incorporated into Kollective IQ, providing users with useful information and handy tips to help them navigate the dashboard and make the very most of their data. 

Analytics and business intelligence are critical to your organization’s success. With the Kollective IQ insights dashboard, you have the functionality and versatility at your fingertips to tell a story of your network, from bandwidth savings to individual event experience. 

If you’d like to see how to create your own custom reports or dig into any of these dashboards more, please register for our webcast  or sign up for a personalized demo at: www.Kollective.com/IQ

THE DEATH OF WINDOWS 7 REPORT

How today’s enterprises are preparing for tomorrow’s security disaster

Microsoft will officially end support for Windows 7 on January 14, 2020, yet 43% of enterprises are still running the outdated platform. Learn how far enterprise businesses are in their migrations to Windows 10, the challenges they are facing and why IT leaders need a software distribution strategy to prepare for WaaS.

Related Blog Posts

The post Critical Analytics At Your Fingertips With Kollective IQ appeared first on Kollective Technology .
To view our Partner blog, click here

When it comes to your video strategy, what does “good” look like?

CMMA Blog

When I was a Kollective customer at one of the largest banks in America, I developed an Online Video Team to manage on Demand publishing and live event streaming. Today, that team is an integral part of the planning and execution of hundreds live video events. These events range from CEO and senior leader all hands to team member learning and development. Regardless of the topic or size, there is a tremendous amount of strategy, planning and resources that go into each successful production. But what happens after the event? Sure, you can hand over a viewership report to your business stakeholder, but she might ask you: “Is that GOOD??”

Just last month, Kollective released our latest enterprise-ready analytics tool, Kollective IQ. As always, we deliver in-the-moment views of viewership metrics and a full complement of network and bandwidth analytics. Now, with IQ, you can take that information and create custom dashboards for your “at a glance” metrics convenience.

Our IT friends love the views of network performance and bandwidth behavior. Kollective IQ’s ability to drill down deeper and see individual details will thrill them, and this information is very useful on the business side too. Let’s start with viewer metrics.

#1 KPI – Unique Viewers

This number identifies the “reach” – the number of individuals who watched the content, be it live or on-demand. a With SAML/Active Directory integration you can use this one metric to find out common characteristics of the viewing population; including “which lines of business were most interested in the content?”, “where are the most viewers located?”, or “does a particular business segment watch this type of content?”

Screen Shot 2019 02 07 at 3.08.13 PM

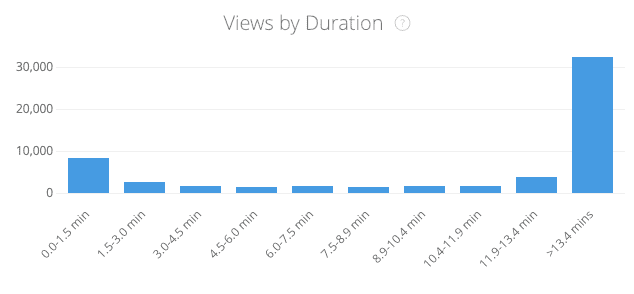
#2 KPI – Average View Duration

This is a quick and easy way to tell if the content was engaging. It’s measured in minutes, not a percentage, so it is easy to match up to the length of the event. You can drill into this data to see if there’s a common drop off time that you can compare to the content and see what was happening at that time. Q&A is sometimes a drop off point, especially if the program is running long.

In the example below, the content was thirteen and a half minutes long. From the graph, you can see that most people watched the whole program.

Screen Shot 2019 02 07 at 2.59.29 PM

Another metric that matters to the business side is: are the bosses watching?  You can use the User Name field and do a quick crosscheck against Employee ID numbers or log in IDs to see who’s there.

#3 KPI – Buffering Report

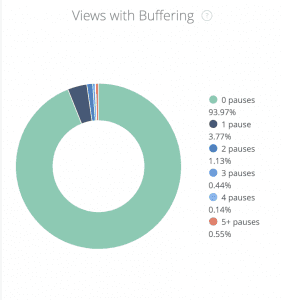
Screen Shot 2019 02 07 at 2.35.36 PMFor me, the most useful technical metric during a live event is the buffering report. If there is buffering in a specific location you can pull out user data and connect with them, informing them that you are aware of the problem and remind them they can watch on-demand after the live event. And, a quick call to your Help Desk lead with this information will make you a hero.

Managing executive expectations and defining what “good” looks from a data-driven approach can help you communicate the success of your enterprise video events and pave the way for future improvements. I’ve covered just a few of the new features of our analytics dashboard. There’s so much more to dive into with Kollective IQ; live event metrics give you updates as viewers join and exit the event along with real time network monitoring. VoD metrics give you a picture of viewership over time and the all-powerful peering efficiency of the content delivery.

take your events to the next level

Learn more about how Kollective IQ can easily provide you with the metrics that matter for your business and how easy it is to customize video viewing and performance metrics for your stakeholders. 

Related Blog Posts

The post When it comes to your video strategy, what does “good” look like? appeared first on Kollective Technology .

To view our Partner blog, click here