facebookpixel

Kollective IQ Makes Microsoft 365 Live Events Smarter

CMMA Blog

In today’s world of highly distributed workforces, live events are essential to maintaining enterprise communications -they give you an opportunity to deliver important messages at scale, create an inclusive environment and make collaboration more accessible than ever before.

After your company hosts a live event, how do you know if your video reached the right people – and what the quality of experience was for the viewer? Only an advanced analytics platform like Kollective IQ can tell you that.

WHY ANALYTICS MATTER

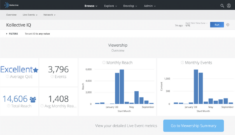
In-depth analytics like reach score, average view duration, quality of experience (QoE score), peering efficiency and bandwidth savings help you gain insight into user trends and satisfaction, leading to a better live event experience for your organization. Customizable analytics dashboards give you the insights you need to improve your understanding of live event performance and take your analytics to the next level.

THE KOLLECTIVE IQ DIFFERENCE

Not all enterprise content delivery network (ECDN) platforms are created equal, especially when it comes to analytics. Do you know who watched your last Microsoft 365 Live Video event? What the quality of experience was? Where they were located? When they accessed the content? With Kollective IQ, you do.

It’s more important than ever to know your virtual events are reaching every member of the workforce, but if you’re relying on standard reporting dashboards, you may not be getting the full picture. Take a look at the analytics capabilities of standard Microsoft 365 Live Events reporting compared to Kollective IQ’s analytics dashboard:

MICROSOFT 365 LIVE EVENT REPORTING:

  • Participants
  • Start Time
  • Event Status
  • Organizer
  • Presenters
  • Producers
  • Recording
  • Production Type

KOLLECTIVE IQ ANALYTICS ADDITIONAL INSIGHTS:

  • Quality of Experience (Event & User)
  • Unique Views by Region
  • Bandwidth & Peering Scores
  • Views by App/Platform/Browser
  • Network Region
  • Bitrate by User
  • Play Duration by User
  • Aggregate Trending
  • Network
  • Performance (Aggregate & Region)
  • Delivery Metrics (Subnet & Region)
  • Custom Metrics & Dashboards

WHAT SETS KOLLECTIVE IQ APART

When you utilize Kollective IQ’s analytics dashboard, you have access to network data and event insights you can act on, like QoE score and regional viewership. Plus, Kollective IQ’s dashboards are customized to your workflow, making it easy to ship data when and where you need it.

Quality of Experience (QoE) Score: A holistic look at the viewer’s experience including time spent displaying video, relative to the total time spent both displaying video and buffering. The QoE score quantifies the quality of a live event and is used to gain deeper knowledge of live event and network performance. If a user has a low QoE score, Kollective IQ can be used to identify that person and send them a video recap of the live event. Having access to your employees’ QoE score allows you to leverage live events insights to improve employee engagement.

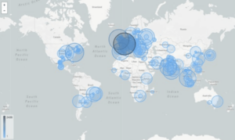
Unique Views by Region: A simplified way to monitor the movement of your workforce and gain insight on where/when they consume video. This tool can give you both a high-level view of users by region and a more granular lens on how the individual consumed your Microsoft 365 Live Event. It also allows global enterprises the opportunity to see how messaging is received globally.

Custom Dashboards: Analytics dashboards customized to your work flow. Imagine this, after your company hosts a Microsoft 365 Live Event, your VP of Communications wants you to generate a report to send to the CEO about how many people viewed your event in a specific office or region – no problem. Creating custom metrics, visualizations and dashboards is easy with Kollective IQ. In addition to standard workflows, you can choose which data sets to highlight, so you can save reports to your own personal workspace or share within the organization.

Get Better Insights into Your Microsoft 365 Live Events

Are you using Microsoft 365 Live Events? Would you like better insights into event performance and employee engagement? For a limited time, when you sign up for the 30-day FREE trial of Kollective ECDN, we’ll extend access to your enhanced analytics for another 60 days – that’s 90 days of FREE analytics!

Visit the offer page to learn exactly what’s included.

The post Kollective IQ Makes Microsoft 365 Live Events Smarter appeared first on Kollective Technology .

To view our Partner blog, click here

Kollective IQ Analytics: Threshold-Based Alerting

CMMA Blog


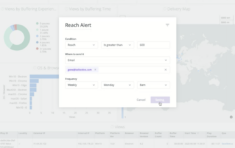
Keeping track of your live event and network performance goals can be challenging – especially given the sheer volume of virtual events many organizations are broadcasting today. Kollective IQ analytics can help. We’ve added even more intelligence to our platform and now offer threshold-based alerting – it’s easier than ever to monitor key performance indicators (KPIs).

Intelligent KPI Reporting

Do you have a goal to reach 6,000 employees with your CEO Townhall Meetings? Does the CIO want to know when peering efficiency of your ECDN is greater than 85%? Is it essential to know when your leadership team has completed their goal for monthly live event broadcasts? With just a few clicks, you can easily set up Kollective IQ automatic alerts when a KPI threshold has been reached.

We’re simplifying data exploration , exportation and reporting .

Try Kollective IQ for Microsoft 365 Live Events

Are you using Microsoft Teams, Stream or Yammer to deliver live video to your distributed workforce? Gain deeper insights into event performance and employee engagement with Kollective IQ for Microsoft 365 Live Events. Try it today for 90 days. It’s free and our ECDN is included for the first 30 days so you can establish baseline network capacity while planning for employees to return to the office.

The post Kollective IQ Analytics: Threshold-Based Alerting appeared first on Kollective Technology .
To view our Partner blog, click here

Kollective IQ Analytics: Ship Data to Anyone, Anywhere

CMMA Blog

Kollective IQ Analytics: Ship Data to Anyone, Anywhere


With Software as a Service (SaaS) adoption increasing across the enterprise, data accessibility is cornerstone to selecting an enterprise content delivery network (ECDN) analytics platform. Not only do you need to be able to mine and explore all data collected by the system, you need to have the option to share valuable insights with your team and key stakeholders. Kollective IQ analytics offers users the ability to ship network and virtual events data to anyone, anywhere.

Easily Share Metrics, Dashboards & Visualizations

Do you need to send an event report to the VP of Communications and presenters, so they know how your last event went? Does your CIO need to know how much bandwidth the ECDN saved over the past month? It’s simple. Just choose the dashboard, metric or visualization you want to share, then schedule who it should go to and how often. Send data daily, monthly or customize distribution.

Eliminate Data Silos

Shipping meaningful data when and where you need it is easy with Kollective IQ. To break down data silos even further, Kollective IQ integrates with Webhook and Amazon S3, both of which can be connected to Microsoft Power BI for automatic data importing.

Try Kollective IQ Analytics for Microsoft 365 Live Events for 90 Days

Are you using Microsoft Teams, Stream or Yammer to deliver live video to your distributed workforce? Gain deeper insights into event performance and employee engagement with Kollective IQ for Microsoft 365 Live Events. Try it today for 90 days. It’s free to sign-up and our ECDN is included for the first 30 days so you can establish baseline network capacity while planning for employees to return to the office.

The post Kollective IQ Analytics: Ship Data to Anyone, Anywhere appeared first on Kollective Technology .
To view our Partner blog, click here

Kollective IQ Analytics: Progressive Disclosure

CMMA Blog


Data is the most valuable currency in today’s modern workplace, but if it isn’t actionable, it isn’t worth much. At Kollective, we understand that if you want to make the smartest, most informed decisions about your enterprise video strategy or network performance, you need data designed for the way you work. That’s why we created the Kollective IQ analytics and intelligence platform with role-specific workflows enhanced by progressive disclosure.

Progressive disclosure is a term coined by user experience (UX) experts to describe the techniques and design patterns that simplify how an individual interacts with a user interface (UI). Here’s how it works in Kollective IQ.

How Progressive Disclosure Works in Kollective IQ

When you first sign into the platform, we give you a 30,000-foot view of how your live events or enterprise content delivery network (ECDN) are performing. These high-level insights include overall quality of experience (QoE), geographic consumption, reach, bandwidth savings and peering efficiency.

From there, you can drop down into the 10,000-foot view. At this vantage you can start analyzing trends for specific data sets and visualize how performance has changed over time.

Want more granular insights? No problem. Kollective IQ can provide insights all the way at the ground level with a single event, user and/or location. All the data collected by Kollective IQ is available for you to mine and explore. Whether you want to want to dig into employee engagement insights from the latest CEO Town Hall or if you need to know how content traversed the network in a remote office location, Kollective IQ makes it easy to do so.

Try Kollective IQ Analytics for Microsoft 365 Live Events for 90 Days

Are you using Microsoft Teams, Stream or Yammer to deliver live video to your distributed workforce? Regardless of where your employees are working, you can gain deeper insights into event performance and employee engagement with Kollective IQ for Microsoft 365 Live Events.

Try it today for 90 days. It’s free to sign-up and our ECDN is included for the first 30 days so you can establish baseline network capacity while planning for employees to return to the office.

The post Kollective IQ Analytics: Progressive Disclosure appeared first on Kollective Technology .

To view our Partner blog, click here

Kollective IQ: The Smartest ECDN Analytics Platform Just Got Smarter

analytics

When it comes to enterprise content delivery network (ECDN) analytics, not all platforms are created equal. Some only surface high-level insights; others limit the data you have access to; many make it difficult to find the metrics that matter. Not Kollective IQ . We provide the deepest and most user-friendly insights into enterprise video streaming and software delivery on the market.

Let’s walk through a few of the reporting features that make Kollective IQ a cut above the rest.

Custom Dashboards, Reports & Visualizations

Screen Shot 2020 09 17 at 8.28.09 AM 1024x589 1

Kollective IQ is designed with intuitive, out-of-the-box user workflows that make it easy for you to find the information that is most important to your role, whether you’re a communications professional, SCCM manager, network administrator or event producer. But the insights don’t stop there – Kollective IQ makes it simple to create custom dashboards, reports and visualizations.

  • Need to report on content deliveries in Hong Kong to your CTO?
  • Does your CEO like to know the metrics tied to their latest All Hands broadcast?
  • Is it imperative you receive immediate insight into security patch deployments?

Kollective IQ makes all your reporting needs possible – you can even deliver locality-specific analytics.

Locality-Specific Analytics

First things first: let’s define what a locality is and why it matters in the context of ECDN analytics.

The dictionary definition of a locality is “the position or site of something.” At Kollective, we define it as a method for managing traffic within an existing network. We do this by controlling peering during a live or on-demand event in accordance with the physical location of machines, regardless of whether they operate off an internal or external IP address.

Here’s an example of how it can work.

Let’s say you’re a network administrator in a company with eight global offices, two of which are in Central America and experience regular bandwidth throttling. Rather than exceed network capacity and compromise business critical applications, you can configure your ECDN to prioritize lean content deliveries by capping playback bitrate in those offices.

With Kollective IQ, you can create custom reports for each locality and share the information collected by the system, providing your teams with the data they need, when they need it.

Insights to Your Inbox: Threshold-Based Alerting

Screen Shot 2020 09 17 at 8.25.22 AM 1024x645 1

With so much going on and so many tasks to manage, it can be hard to track the progress of your goals. Not anymore. With Kollective IQ, you can easily set up and automate alerts to let you and your colleagues know when certain KPI thresholds have been reached.

  • Want to be alerted when you achieve an excellent Quality of Experience (QoE) score during a monthly CEO Town Hall meeting?
  • Need to know when you are saving 90% or more of bandwidth when releasing the latest Windows 10 update?
  • Want an update when your broadcast event has reached all 2,000 of your first-line healthcare employees?

Setting up alerts in Kollective IQ is easy and gets you the data you need, when you need it.

Easily Import Data from Kollective IQ into Power BI

As cloud-based applications become more popular throughout the enterprise, controlling SaaS sprawl has become a common conversation among IT teams – especially when it comes to reporting and data silos. At Kollective, we recognize how important it is for our technology to play nicely with business intelligence platforms like Microsoft’s Power BI and we’ve made it easier than ever to push data into third-party systems.

In less than five minutes, you can automate reporting from Kollective IQ into Power BI using Webhook or Amazon S3.

Trial Kollective IQ

Ready to see Kollective IQ in action? Signing up is easy. It only takes six clicks – and it’s FREE. Kollective IQ is included in every ECDN trial.

The post Kollective IQ: The Smartest ECDN Analytics Platform Just Got Smarter appeared first on Kollective Technology .

To view our Partner blog, click here

6 Metrics You Need to Know to Analyze Live Video Performance

CMMA Blog

COVID-19 has changed the way world works and Live Video is now essential to maintaining enterprise communications . But how do you know if your videos are reaching the right people – and what the quality of the experience is for the viewer?

The answer to those questions and more can be found in your Live Video analytics dashboard. Here are six metrics you need to know to analyze Live Video performance.

Reach Score

The first metric you need to know is reach score. It is determined by summing the number of unique views with the number of anonymous viewing sessions. An anonymous viewing session is a view that cannot be determined, like if a viewing machine does not properly report play by a Globally Unique Identifier (GUID).

As opposed to solely reporting on unique viewers, reach score gives better insight into the total number of individuals reached by a Live Video. You can use this metric to evaluate the performance of your pre-event promotions: How many people showed up relative to the number invited? How does this compare to previous events you’ve hosted?

From there, you can draw parallels between lead time, invitation format, and even the business segments invited.

Average View Duration

Analyzing average view duration is the quickest and easiest way to tell if the content of your Live Event was engaging when compared to a baseline measure. By viewing aggregate data in the event summary dashboard, you can get a general idea how your audience typically behaves. Do they stay online for the entirety of a Live Event? Or do they drop off at the end of a session when the Q&A portion typically starts? Once you have a good understanding of this, you can compare it to the most recent event data to determine engagement.

Quality of Experience (QoE) Score

Nothing can derail a user’s experience quicker than buffering. Unfortunately for many enterprises, it’s an all-too-often occurrence when streaming Live Video to remote offices and worksites. Thankfully, QoE score gives organizers Insight into how end users experience their Live Events.

At Kollective, our QoE score is based on the time spent displaying video relative to the total time spent both displaying video and buffering – buffering in this case includes buffering before video startup and during playback. Here’s how it’s calculated:

The total time a user spends expecting to watch a video is described as:

TTotal = TBuffering + TPlaying + TStalled

Therefore, the QoE score would be equated such that:

QoE = (TPlaying / TTotal) * 100

The “good” threshold for QoE score is 90% or greater, while a “bad” QoE score is less than or equal to 70%.

A buffering video not only impacts view-ability and employee engagement. It can mean there are serious bottlenecks in your network that may be affecting business application performance. For businesses with Live Video QoE scores that fail to meet users’ expectations, an Enterprise Content Delivery Network (ECDN) can help alleviate the pressure on your network. Live video is a notoriously bandwidth heavy medium, and as the demand for it grows, you need to know that your network can reliably scale content to reach all employees.

Bandwidth Savings

Once you’ve implemented an ECDN, it’s easy to monitor how much bandwidth it saves during each Live Event. Bandwidth savings is defined as percentage of bytes delivered via peering. Network administrators can reference this metric to determine ECDN effectiveness and network capacity.

Geographic Consumption

Kollective IQ GeoExplorerNow that you know how many people attended your event, what their experience was, and how much bandwidth you saved using an ECDN, it’s time to investigate where you content is being consumed. Kollective’s GeoExplorer allows you to drill down into how much content was consumed by how many users, even if there was a lag or buffering that occurred during event delivery.

This gives global enterprises the opportunity to see how messaging is received across the organization. Identify your top performing offices and those that need additional attention.

Peering Efficiency

Kollective’s ECDN leverages browser-based peering to deliver Live Video. Rather than relying on a single distribution point, it uses WebRTC Technology to enable direct peer-to-peer communication for all network-connected devices in a modern workplace. Peering efficiency is the normalized percentage of bytes delivered via peering. Or, in layman’s terms, how efficiently these connected devices transmit Live Video.

Learn More About What Great Analytics Reveal

Want to learn more about what great analytics reveal about Live Events? Join us for a webinar where we’ll teach you the ins and outs of Live Video reporting for Microsoft Teams.

The post 6 Metrics You Need to Know to Analyze Live Video Performance appeared first on Kollective Technology .

To view our Partner blog, click here