facebookpixel

Critical Analytics At Your Fingertips With Kollective IQ

analytics

According to Gartner , “CIOs globally ranked analytics and business intelligence as the most critical technology to achieve the organization’s business goals.” Ventana Research  found that many capabilities still not available include predictive analytics & visualization.  

These data points act as the pillars for our new analytics product, Kollective IQ. Kollective IQ is the most sophisticated delivery management performance dashboard for the enterprise. We’ve provided easy access to the data you need, that’s visually appealing and gives your network and communications teams actionable insights.    

No matter your role within an organization, you can quickly access information most relevant to you. In this post, we’ll begin to explore four new benefits of Kollective IQ.  

Event Analyzer Dashboard
Screen Shot 2018 12 05 at 9.25.50 AM

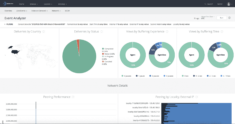
Our event analyzer dashboard provides users with network-focused visibility so that they can view historical data from any specific event as well as seeing what is happening during an event in real-time. This provides invaluable insight across the company, allowing IT teams to monitor bandwidth, CEOs to see how many people tuned into their latest company update, and communications professionals to see how effective video content is proving across different offices or departments. 

Dashboard Drill Downs
Screen Shot 2019 01 25 at 2.14.52 PM

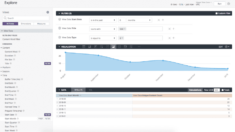
Every tile in the dashboard is now drill-able, allowing users to pinpoint where there were buffering issues, slowdowns or glitches. This enables users to drill down into data from months, weeks or even a specific live event. Intelligent keywords also makes it possible for users to analyze multiple events based on the same theme. 

Portability
Screen Shot 2019 01 25 at 2.18.30 PM

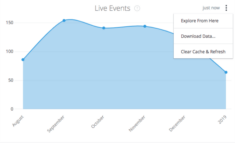
Kollective IQ’s new report-export features, data visualizations and search filters mean that users can easily and rapidly explore or download the data that matters most to them. Export the reports or your entire dashboard into a PDF, as a CSV or you can send it directly through email. You can even schedule automated future reports. Your metrics that matter are no longer locked in a single system and you can use any of these export actions to get your data into any other BI solution you are using. 

ToolTips

Screen Shot 2019 01 25 at 2.19.55 PM

Tile-based ToolTips and real-time help features have been incorporated into Kollective IQ, providing users with useful information and handy tips to help them navigate the dashboard and make the very most of their data. 

Analytics and business intelligence are critical to your organization’s success. With the Kollective IQ insights dashboard, you have the functionality and versatility at your fingertips to tell a story of your network, from bandwidth savings to individual event experience. 

If you’d like to see how to create your own custom reports or dig into any of these dashboards more, please register for our webcast  or sign up for a personalized demo at: www.Kollective.com/IQ

THE DEATH OF WINDOWS 7 REPORT

How today’s enterprises are preparing for tomorrow’s security disaster

Microsoft will officially end support for Windows 7 on January 14, 2020, yet 43% of enterprises are still running the outdated platform. Learn how far enterprise businesses are in their migrations to Windows 10, the challenges they are facing and why IT leaders need a software distribution strategy to prepare for WaaS.

Related Blog Posts

The post Critical Analytics At Your Fingertips With Kollective IQ appeared first on Kollective Technology .

To view our Partner blog, click here

Kollective IQ Has Some New Data Magic Up Its Sleeves

analytics

As you may imagine, childhood for someone who grew up to find a career in building data and analytics platforms was filled with… well… chess club. Obviously. Time at the library? Sure. Legos, a wide array of board games, and last but not least, learning card tricks from my older brother. With every new trick that he would show me, I would feel a sense of awe and that something magical was afoot. And as soon as the trick was finished, I would always have the same question… “How did you do that?”.

Analytics, when done right, often feels like magic. It reveals insights that we didn’t know were possible, and it wows us. It knits together data and metrics uncovering something that felt hidden and unknowable before. And it usually leaves us with that same burning question of ‘how did this seemingly magical insight come about?’

Here on the Kollective IQ (Kollective’s enterprise-ready analytics and intelligence platform) Team, we have had our noses to the grindstone building out an analytics suite that we hope delights, informs, and delivers the insights you need, where you need them. We did this by no slight-of-hand, but by spending a lot of time with our customers – listening to their business problems, understanding their KPI’s and critical metrics, and gaining an understanding of the data that would make their lives at work easier.

With that in mind, we are excited to announce the addition of two new features currently in development in Kollective IQ that add some “magic” to the platform.

The GeoExplorer

Screen Shot 2019 03 08 at 2.27.18 PM

Kollective IQ GeoExplorer

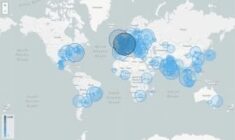
As our clients continue the digital transformations of their businesses, we hear over and over the common refrain from network administrators and communications leads alike, “We are a global company, and it would change my life at work if I could see how our messaging is consumed across the globe, and how successful it was in reaching all of our offices. ESPECIALLY the ones that we know are short on bandwidth and high on the need to connect to the rest of the organization.” We wanted to solve this. And that’s where the GeoExplorer comes in. The GeoExplorer will give you insights into how your content AND your network performed across all of your locations globally. In an incredibly visually-striking, engaging and interactive manner. Whether you want to see how much content was consumed, how many users consumed the content, or even if there was a lag or buffering event in the delivery, the GeoExplorer effortlessly surfaces the insights to you.

The Network Explorer (Peering Graph)

Screen Shot 2019 03 08 at 2.27.26 PM

Kollective IQ Peering Graph (NetworkExplorer)

We know that network intelligence is hard to come by. Getting network intelligence in a form that is not incredibly cumbersome and in the form of a complex data table is even harder to find. For the last year, we have been thinking and prototyping a way of delivering network intelligence and insights that does the heavy lifting for you. Enter the Network Explorer. By presenting your network in a “force graph”, and allowing you to filter the graph by the metric that you need to quickly know about (buffering, peering, locality, External IP’s), you can gain insights in seconds that would normally have taken hours and sometimes days to assemble. While it took the data team here many prototypes and months of work to model and structure the data in a way that will satisfy the market and delight our customers, upon release it will transform the way you can view your network, it’s performance, and the content that is being delivered across it. It was worth the wait, and the countless hours poring over the data and data science backing this dare I say, “magical” tool.

FIND OUT MORE

If you’d like to see a demo of these new features, and all of the other terrific actionable tools in Kollective IQ, request a demo today.

8 Ways to Boost Trust and Transparency in Your Organization

When employees and customers trust their leaders, a company is better able to weather crises and excels.

Related Blog Posts

Successful Enterprise Live Video in APAC

A couple months ago I was fortunate enough to be able to travel to Asia to work on a couple customer events. Asia, and Japan in particular, have always been at the top of my bucket list. Kollective has offices in the region, and as our technology is able to deliver…

read more

The post Kollective IQ Has Some New Data Magic Up Its Sleeves appeared first on Kollective Technology .

To view our Partner blog, click here

Why Network Analytics is the Key to Digital Transformation

analytics

Think about your average town. Its roads, freeways and neighborhoods were slowly built up over years or even decades to handle the natural, steady growth of its population.

Now imagine an unexpected population boom thanks to a new industry, newly discovered natural resource or making the top of a “Best Places to Live” list. What happens when that town has to handle twice as many people or more, all at once? Gridlock.

For most enterprises, their networks were built up over the years to solve the data transmission issues of the day. However, few enterprises were prepared for the crushing demand of digital transformation. Networks are now handling massive data files like HD video files, while teams are collaborating on documents in real-time. As Windows 10 moves to a software-as-a-service model, networks are becoming inundated with software patches and regular upgrades.

Just like a town experiencing a population boom can’t just toss up a new freeway, it’s unrealistic to expect an enterprise to quickly build out their network to handle all this new data. Instead, they must think about their networks strategically to ensure they’re alleviating the most congestion at the most crucial chokepoints.

That’s where network analytics come in. By collecting and analyzing network performance data, you can make the right decisions at the right time to improve the overall user experience. With a robust network analytics program in place you’ll be able to spot problems and trends, and then determine the most effective solution.

Here are just a few of the things your network analytics should be able to tell you:

  • How fast crucial data like a software patch is being deployed
  • The impact on your overall network performance during a large data event like a video livestream
  • Endpoint performance to see if a patch was a deployed or a training video watched
  • Where data is getting choked on your network
  • What priority you are putting on your critical data like live video and software patches versus less time-sensitive data

When building out your network analytics solution, it’s not enough to just collect raw performance data. Your analytics must be actionable, telling you what you need to know and what you need to fix. Better yet, the analytics tool should be automated so that it can actually fix issues for you by rerouting data around choke points or prioritizing critical data.

With digital transformation, the network is no longer a piece of infrastructure. It’s the platform on which your business is built. Operations, manufacturing, marketing, finance, HR, logistics, sales and every other department are dependent on the network to do their work. Insight into its performance is critical.

With the right network analytics solution, you’ll be able quickly determine its current performance, make better predictions about future performance.  This then translates into enabling future business performance. In addition, your advanced network analytics will let you make network investments surgically and strategically. With the right knowledge, it can be the network equivalent to putting in a couple of traffic lights instead of having to build out a whole new freeway.

Learn More About Our Enterprise Video Solutions

Kollective seamlessly delivers your live streaming content to the edge of your network.

Related Blog Posts

Page 1 of 1012 3 4 5 10 Last »

The post Why Network Analytics is the Key to Digital Transformation appeared first on Kollective Technology .

To view our Partner blog, click here